CIC Impact Report
The Challenge: Demonstrate real world impact associated with CIC’s mission
My Role: Create a long-form storytelling publication with measurable stats
Stakeholders: Every team in the company
Collaborators: Launch team lead, sales team lead, marketing director, design consultant
Methods + Tools: Adobe InDesign, Adobe Illustrator, Google Suite
Results: 60+ page publication positioning the company viewed by 3000+ visitors
Cambridge Innovation Center (CIC)’s mission is to fix the world through innovation, but how much is it truly impacting the world? This question prompted me to create their first ever Global Impact Report (live on CIC’s website here).
CIC creates a tight community for its clients, and has a strong reputation through word of mouth, but hadn’t been collecting comprehensive data about its achievements or making a complete case publicly.
As the creative director and project lead for the 2018 and 2019 Reports, I organized data and feature stories from across all departments and locations, balancing stakeholder’s needs to create a clear narrative of success, growth, and client loyalty.


Infographics were developed for key metrics, making it easier for CIC’s expansion team to argue that developers and investors should partner with the company. These graphics also assist sales teams in demonstrating CIC’s track record for startup growth and investment.
2019’s report theme and visual was developed in partnership with Kim Friedman. I iterated and extrapolated from her proposed visual direction to complete the spreads.

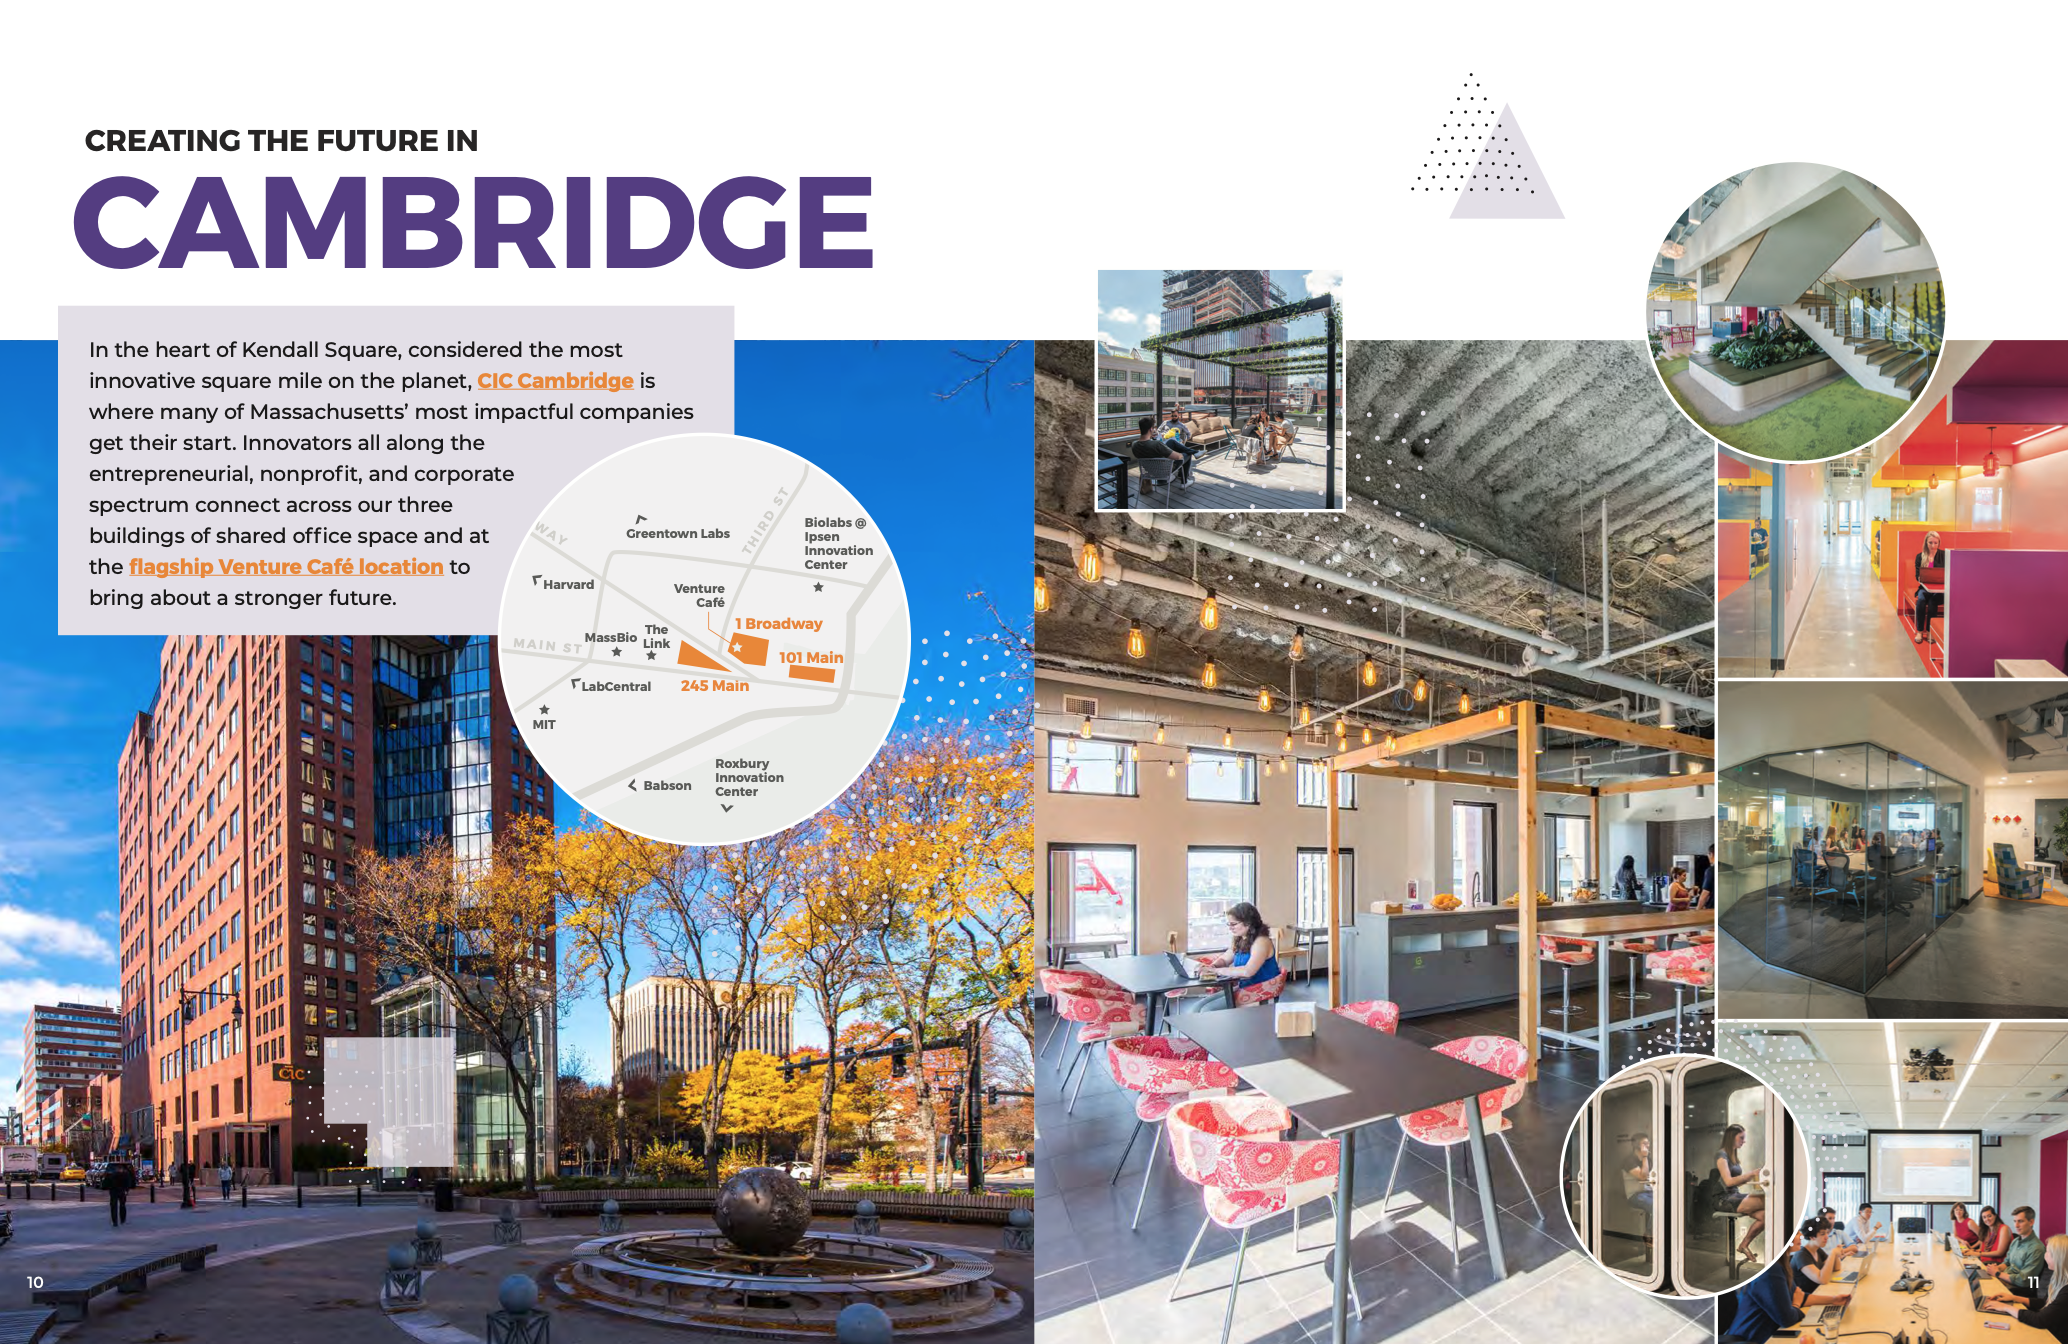
Location splash page example: Cambridge
Location splash page example: St. Louis

Timeline of important CIC events, demonstrating increasing complexity and growth


The 2019 report included content from almost every team in the company, as well as contributions from many consultants.
The 2019 publication was the first complete, fully developed report, but it would not have been possible without its predecessor. In 2018, I created a scaled down document as a proof of concept, which won me approval to direct a larger and better resourced team the following year.
The “beta” version of the Impact Report, CONNECT 2018, was published in April 2019.


